© 2026 ALLCITY Network Inc.
All rights reserved.


The NBA community has never had more tools. Over the past decade and change, basketball has accelerated into its information age, for better and worse, providing those who watch it the machinery that can analyze it at a granular level not even imaginable in the past. We have more data, smarter metrics, new websites, and this change has mirrored how the league’s decision makers, those involved in front offices and coaching staffs, think about the sport, too.
Basketball’s still an entertainment product at its core, one whose fans don’t need these gadgets to watch its drama. Many more have also embraced this data surge, which might include you. If you have, you may know about databallr.com; it’s a site I found around this season’s start, one which impressed me with its seemingly unlimited features and especially with its ease of access. It wasn’t long after that the screenshots started flooding my social media feeds, most often ones showing on-off data for various players to prove various points about them. It inspired me to write about that statistic earlier this month.
I also reached out to databallr’s creator, who had previously been interviewed last year by Owen Phillips, a basketball data writer who has since been hired by the Denver Nuggets. In that interview, databallr’s creator shared he was previously a professional poker player, competitively ranked MOBA video game player, and why he has remained anonymous in his basketball journey. Given databallr’s success, at least from what I see in its ubiquity on my social feeds, I decided I’d reach out, too.

I agreed to keep his anonymity for this interview, which was conducted over the phone last week as well as edited and condensed for clarity and readability. I also added some additional statistical context in italics around this interview to help clarify some things we discussed since it can be a dense topic.
***
What was the inspiration behind databallr?
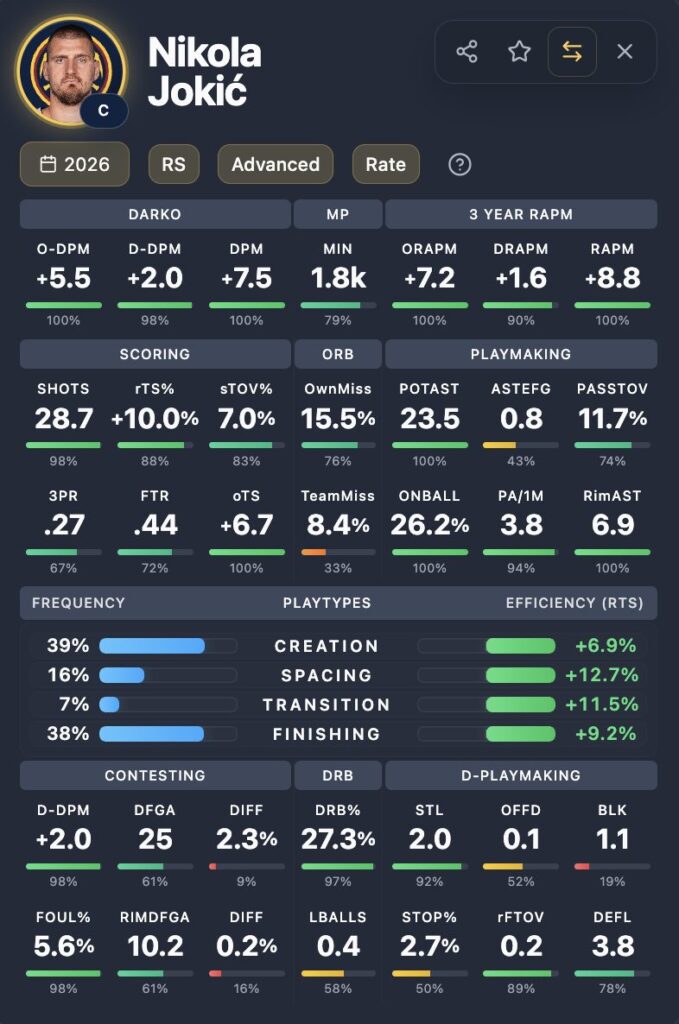
I’ve been very interested in impact analytics, and I first made nbarapm.com. The inspiration was seeing long-term RAPM analytics and realizing they were useful for evaluating players historically. Looking through the data, I noticed there were players that graded out better than public perception, often for specific reasons. (RAPM stands for Regularized Adjusted Plus-Minus, a metric aiming to account for the needed context and randomness that can affect plus-minus.)
Don't like ads?
What I tried to do with nbarapm.com, and what I’m doing now, is show there are different aspects of the game that I don’t think people can intuitively quantify. When people talk about defense — things like rebounding and steals — how much do those actually matter? How much does that actually affect the game?
Reed Sheppard is a great case study, right now, if his steals are more important than man defense. (He’s great at first, bad at the second.)
That’s part of the reason he was picked so high, he had a nearly five percent steal rate in college. Forcing turnovers generates significant value. That’s the main driver behind Alex Caruso’s high analytics. He’s great at everything on defense, but he’s the GOAT at forcing turnovers. And there’s a certain quantifiable impact to that. But it’s not intuitive how much value you can drive through other areas relative to scoring or rebounding.
Right, scoring is the only one with a point valuation assigned to it, but we know a steal has value. We just can’t assign value to that from the box score.
Steals have a very high expected value. It eliminates an opponent’s possession, right?
There’s some nuance to it: how much time is left on the clock, how much credit the person who got the steal deserves. You’re essentially saving over a point by doing that, and a point is a lot. (This season, teams have averaged 1.15 per possession.) What confuses people about this, in my opinion, is when you say, “You’re saving a point with a steal,” and then compare it to scoring a point. It’s not the same thing, because when you’re scoring points, you’re also taking shots.
Don't like ads?
Basically, I’ve thought that the possession game was massively undervalued. It’s just not talked about, really, at least on Twitter and Reddit. Most fans care about scoring efficiency, playmaking. I mean, that’s the most fun stuff to watch, right?
But there’s this other force in the game: the possession game. How many extra possessions do you get for your team and take away from the other team? Rebounds are tricky. You can’t just count the number of rebounds you get. It doesn’t work like that. It’s about impacting your team’s rebound rate.
I wanna talk more about this, but a couple table-setting questions first: How did you build this site?
I got increasingly interested in NBA analytics in 2024 and started working more directly with the data. From there I began building the site. I had some early help from Gabe from courtsketch.com, who I met through the Thinking Basketball community. He helped me get oriented with pulling the data, and once I could do that consistently I started building out the platform.
I’ve been on the forefront of some AI tools out there. I’m fairly open minded and experimental, I’m always looking at different designs and libraries and integrating them when I can. I’ve got a lot more coming in the next couple weeks, too.
And I tried to optimize for mobile. I saw on Twitter what types of things people were interested in, what was shareable. I tried to make my content shareable so it would try to create an organically growing site that it’s not relying on me to necessarily market it to people.
Don't like ads?
That was my next question. I feel a lot of the site’s success has obviously benefitted from the social shareability. That’s how creating online content works, of course.
I have experience building some really cool things. But if it’s not actively marketed, it doesn’t matter. It doesn’t matter how good your product is if you don’t have that.
Last week, I wrote about all that context required for on-off stats, and that’s been the site’s most shared feature from what I’ve seen. I think it’s good for more information to be more accessible. It also means people will misuse it. I’m curious how much you thought about that during the site’s creation.
I didn’t actually think people would misuse it. I like looking at the raw on-off data occasionally just to see what’s been happening recently, what’s working, what’s not. It’s a snapshot to see when I’m evaluating, you know, the top-end players. What types of relative offensive ratings are they reaching in their lineups over a period of time?
Could you explain that in broader terms for the readers who might not know?
A lot of people will use lineup data and then they’ll see the combinations of players and essentially try to say, “Well, this player is worth this much because the lineup data looks like this.” Particularly in small samples.
Don't like ads?
RAPM looks at longer samples. It can weigh things by recency: If you have three years of data, you can weigh yesterday a lot more than you could two-and-a-half years ago. It basically solves each player’s value based on the lineups they played with and the opponents they faced.
In the raw on-off numbers, Kentavious Caldwell-Pope had really nice raw on-off data in 2023, but he was paired with Nikola Jokic for most of his minutes. When Caldwell-Pope was on the court and Jokic was off, those lineups were markedly worse. RAPM accounts for that and assigns most of the value to Jokic rather than treating Caldwell-Pope like a superstar.
The RAPM numbers are going to be much more accurate. People like to see lineup combinations, they want to see synergies. They want to see what’s happening recently. And I do think people are getting fooled by randomness a little bit. I think I need to provide more education on the site.
I do feel you’ve tried that! The 3-point percentages are directly in the shareable screenshots. (In smaller samples, on-off data is often skewed by outlier shooting performances in either direction by either team.) The padding tool is another feature I’ve seen, you even posted about it.
The thing is, I get it. People seem to naturally react to 20-minute sample sizes, and it just gets a lot of engagement.
I think a lot of it is just not understanding the statistics. It triggers a reaction from some percentage of fans. When I originally made this, I actually only allowed you to choose up to three players (to compare on-off splits for those lineups). People were like, ‘I wanna see four and five’, which, you know, the sample gets cut even further. But people really wanted it, right? So I did it.
Don't like ads?
(laughs) I get it. So there’s always been this war between analytics and film people, and there’s a million reasons for it. I think it’s a misunderstanding of each one’s priority. I do think what’s at the core of this debate is, basically, how we enjoy this entertainment product. I’m someone who finds more interest when I can approximate how decision makers, people in front offices and coaching staffs, think about the sport that’s happening in front of them. But that removes some of the raw emotion I had as a kid, and I sometimes miss that. I’m curious where you fall.
What I’d like to say about analytics vs. film is that analytics is necessary because, even if you have a perfect eye for the game and you see everything going on, if you don’t know how to value what you’re watching — steals, for example — you can analyze everything someone’s doing, right? But you can’t convert that to some amount of value. You can say someone’s really good, but there’s a lot of good players. How can you differentiate between good? It’s only by breaking down some of the sub components.
One of my friends was doing his film study on draft prospects. He was assigning values to all the actions. But if you don’t assign the right value to the actions on the court, then your results won’t be correct. You have to get into the analytics to have a grounding or an understanding of what those actions are worth.
Someone can look good taking the shot, but if it doesn’t go in enough … it just matters how much the ball goes in the hoop.
We do have a human bias towards things that look cool. Kyrie Irving’s very efficient, but if he wasn’t, I don’t think it would entirely change how he’s talked about because of how cool he makes the sport look, even if it wasn’t affecting how often teams win games.
Yeah, I agree. You can watch and get a feel, but there are events outside the box score that matter as well. I allow for a lot of impact outside the box score. I think ball movement is really important. I think screening can be important. I think knowing who should have the ball, decision making, has an impact. There’s a lot of small things that add up that film’s important for that you may not have. Those stats may not be easily available.
Don't like ads?
Boxing out and hustle is important. Some of that’s reflected in stats, some of it isn’t. On defense in particular, the stats are not as good. Film’s really important on that end, like communication and awareness, some of the rotations players make. Film’s mandatory for that.
On-off stats can point out that a player has a positive defensive impact, but it doesn’t necessarily say why they’re having that impact, and that context is obviously crucial to NBA teams so they can take this defensively impactful player and put them into situations where they can replicate that impact the stats showed they had. (This is how front offices must and do think.)
If your team has a bad defensive scheme, or if it doesn’t have the right cohesion of defense, everyone’s going to look worse, right? But Oklahoma City or Boston, do they have excellent players? Yes, but are all their players looking better than they probably are? Also yes. I think they both have elite offensive and defensive schemes and I think their players are optimized. There’s probably a lot of situations where they’re not.
Any site features you wish were used more?
I’ve made a lot of cool pages. I was surprised the showcase page wasn’t that popular. I think, ultimately, people like seeing data in tables. You can click on people’s pictures, it brings up their stats, you can click on cells to see leaders for that year’s particular stat. It’s cool, but it’s not as popular.
The dashboard gets a lot of usage, and I’m focused on improving it. While my current dashboard presents all this data, I don’t think it’s optimal quite yet. I have some cool ideas for that.
Don't like ads?
I think I’ve seen on-off screenshots so much because, even though sports debates we’re having are getting smarter and using more information, I think that part of the website allows you to go ‘dunk’ on somebody else in an internet argument. I think that’s the human psyche. It’s my theory, anyway.
That’s part of what I saw at the start. Stathead screenshots (which are a Basketball Reference feature) were popular. I thought I could create something more customizable and easier to use with deeper stats. That was when I knew there was demand for that.
Last question, but there’s a long track record of people who create interesting public-facing sports data sites and then get hired by NBA teams. Just curious, is that something you’re interested in? How much do you know people within the NBA are aware of your work?
I’ve received positive feedback from people working for teams. I’ve talked to a few teams. But I have some ambitious plans for the sites, so right now I’m focused on building them.
Tim Cato is ALLCITY’s national NBA writer currently based in Dallas. He can be reached at tcato@alldlls.com or on X at @tim_cato.
Comments
Share your thoughts
Join the conversation

The Comment section is only for diehard members
Scroll to next article
Don't like ads?
Don't like ads?
